Tuesday, July 2, 2024

EPA Settles Safe Drinking Water Act Claims with Power Company in Southern California

SAN FRANCISCO – Today, the U.S. Environmental Protection Agency (EPA) announced a settlement with Sunrise Power Company for claims of Safe Drinking Water Act violations at the company’s Sunrise Power Plant in Kern County, California. Sunrise Power has agreed to pay a penalty of $55,788 to resolve permit violations of the Underground Injection Control Program.

“Facilities operating underground injection wells must comply with all permit conditions in order to protect underground sources of drinking water,” said EPA Pacific Southwest Regional Administrator Martha Guzman. “Failure to adhere to all permit requirements risks damage to vital and limited groundwater resources.”

EPA classifies injection wells into one of six types. Sunrise Power has a permit to inject non-hazardous waste, such as plant and equipment drains wastewater, into the Upper Tulare formation via a Class I Non-Hazardous Waste Injection Well permit. EPA claims that in June 2022 Sunrise Power violated the permit and the Safe Drinking Water Act by failing to maintain the mechanical integrity of an injection well, allowing wastewater to rise to the ground surface.

Injection wells are used to place fluid underground into porous geologic formations for storage or disposal. EPA’s Underground Injection Control Program works with underground injection well owners and operators to ensure their practices do not impact underground sources of drinking water. EPA conducts regular inspections to verify injection well operations comply with the injection well permits and applicable requirements.

Read EPA's proposed settlement with Sunrise Power Company.

Learn more about EPA’s Underground Injection Control Program.

Read about EPA enforcement and how to report possible violations of environmental laws and regulations.

Learn about EPA’s Pacific Southwest Region. Connect with us on Facebook, Instagram, and X.


from EPA News Releases https://ift.tt/uKf60OV

EPA Releases Updated Climate Indicators Report Showing How Climate Change is Impacting People’s Health and the Environment

WASHINGTON — Today, July 2, the United States Environmental Protection Agency released the Fifth Edition of Climate Change Indicators in the United States. The report highlights new data showing the continuing and far-reaching impacts of climate change on the people and environment of the United States. New to the report this year are an indicator on Marine Heat Waves (showing trends related to multi-day high ocean temperatures) and a feature on Heat-Related Workplace Deaths.

“EPA’s Climate Change Indicators report is an authoritative resource of how the climate crisis is affecting every American right now and with increasing intensity,” said EPA Administrator Michael S. Regan. “Extreme heat, flooding, and wildfires have become more common, harming human health, threatening livelihoods, and causing costly damage. Regular updates to the data in the Climate Indicators website and report help us track these unprecedented changes so we are better informed in our shared work to confront the crisis.” 

The Fifth Edition presents highlights from a subset of EPA’s total of 57 indicators, which include historical data and observed trends related to either the causes or effects of climate change. The report explores the interconnected nature of observed changes in climate with chapters thematically organized around Greenhouse Gases, Heat on the Rise, Extreme Events, Water Resources at Risk, Changing Seasons, Ocean Impacts, Rising Seas, and Alaska’s Warming Climate. Since publishing the first edition in 2010, EPA has maintained an up-to-date online resource of climate change indicators and regularly released updated publications that present the latest data.

EPA partners with more than 50 data contributors from various U.S. and international government agencies, academic institutions, and other organizations to compile these key indicators of climate change. EPA’s indicators show multiple lines of compelling evidence that climate change is increasingly affecting people’s health, society, and ecosystems in numerous ways. For example: 

  • Global and U.S. Temperature – Worldwide, 2023 was the warmest year on record, 2016 was the second warmest, and 2014–2023 was the warmest decade on record since thermometer-based observations began. In the U.S., unusually hot summer days have become more common over the last few decades, and unusually hot summer nights have increased at an even faster rate, indicating less “cooling off” at night.
  • Heat Waves in U.S. Cities – Heat waves are occurring more often in major cities across the United States. Their frequency has steadily increased, from an average of two heat waves per year during the 1960s to six per year during the 2010s and 2020s. The average length of the heat wave season across the U.S. cities is 46 days longer now than it was in the 1960s and, in recent years, the average heat wave in major U.S. urban areas has lasted about four days.
  • A Closer Look – Heat-Related Workplace Deaths - From 1992 to 2022, a total of 986 workers across all industry sectors in the United States died from exposure to heat of which the construction sector accounted for about 34 percent of all occupational heat-related deaths. During this time frame, 334 construction workers died due to heat exposure on the job.
  • Sea Surface Temperature – Over the past century, sea surface temperature has increased and continues to rise. Sea surface temperature has been consistently higher during the past three decades than at any other time since reliable observations began in 1880.
  • Marine Heat Waves – Between 1982 and 2023, the annual cumulative intensity of marine heat waves has increased in most coastal U.S. waters, with the largest changes in waters off the Northeastern U.S. and Alaskan coasts. When a location experiences an increase in annual cumulative intensity over time, that means marine heat waves are becoming either more common, longer, more intense (hotter), or some combination of the three.
  • Marine Species Distribution – In conjunction with warming ocean waters, many marine species off U.S. coasts are shifting northward and are moving to deeper waters. Since the 1980s, shifts have occurred among several economically important fish and shellfish species. For example, American lobster, black sea bass, and red hake in the Northeast have moved northward by an average of 145 miles.
  • Coastal Flooding – Tidal flooding is becoming more frequent along the U.S. coastline. Most sites with long-term data experienced an increase in tidal flooding since the 1950s. At more than half of these sites, floods are now at least five times more common than they were in the 1950s. The rate of increase of flood events per year is largest at most locations in Hawai'i, and along the East and Gulf coasts.
  • Wildfires – The extent of area burned by wildfires in the United States has increased since the 1980s, with the largest increases occurring in the West and Southwest. Of the 10 years with the largest acreage burned, all have occurred since 2004, including peak years in 2015 and 2020. This period coincides with many of the warmest years on record nationwide.
  • Length of the Growing Season – The average length of the growing season in the contiguous 48 states has increased by more than two weeks since the beginning of the 20th century. A particularly large and steady increase has occurred since the 1970s. States in the West (like Washington and California) have seen the most dramatic increase.
  • Snowpack – From 1982 to 2023, the snowpack season became shorter at 80% of the sites measured. Across all sites, the length of the snowpack season decreased by an average of about 15 days and peak snowpack has shifted earlier by an average of nearly seven days since 1982.
  • Arctic Sea Ice – The September 2023 sea ice extent was the fifth smallest on record. It was about 789,000 square miles less than the historical 1981-2010 average for that month – a difference almost three times the size of Texas. Since 1979, the length of the melt season for Arctic sea ice has grown by 37 days. On average, Arctic sea ice now starts melting seven days earlier and starts refreezing 30 days later than it has historically.

Understanding and addressing climate change is critical to EPA’s mission of protecting human health and the environment. Tracking observations over time reveals valuable information about what people are experiencing today and can help inform climate solutions. The Fifth Edition of the Climate Change Indicators in the United States report provides abundant evidence of how climate change is happening all around us. Taking action to fight the urgent threat of climate change is an opportunity to build more resilient infrastructure, protect public health, advance environmental justice, strengthen America's working communities, and spur American technological innovations.

Download the report.

Explore EPA’s climate change indicators.


from EPA News Releases https://ift.tt/J7H6rMN

Monday, July 1, 2024

EPA awards Massachusetts $254,000 to support water quality monitoring at beaches

BOSTON (July 1, 2024) – Today, the U.S. Environmental Protection Agency (EPA) celebrated a $254,000 grant to the Massachusetts Department of Public Health to protect the health of beachgoers. This funding is part of $9.75 million in grants, announced in June, to help coastal and Great Lakes communities. The funding will support water quality monitoring and public notification programs for beaches.

Standing with partners at King's Beach in Lynn today, EPA Regional Administrator David Cash highlighted the importance of the funding, especially for vulnerable communities.

"Beach closures and advisories are harsh realities on blistering hot summer days and the continuing concerns at King's Beach remind us there is more work to be done, " said EPA New England Regional Administrator David W. Cash. "This grant will advance environmental justice in Massachusetts communities vulnerable to and overburdened by water quality impacts by supporting critical monitoring and notification programs. We will continue to work closely with our state, municipal and local partners to deliver information that people need to make good decisions about their health."

"It's simple—on summer days, people deserve clean, safe beaches to swim in," said Senator Edward J. Markey. "The funding announced today will ensure that real time monitoring data can inform the community when it is safe to swim. This is a positive step as we continue to work together to ensure King's Beach will remain open for recreation—because access to beautiful and swimmable Massachusetts beaches shouldn't be determined by your ZIP code."

"For too long, beachgoers risked exposure to unsafe bacteria levels when swimming at King's Beach on a hot summer day," said U.S. Senator Elizabeth Warren. "This EPA funding will allow us to better monitor water quality and represents a first step towards transforming King's Beach into a clean, safe beach for the people of Lynn."

"As we continue our collaborative efforts to make King's Beach safe and swimmable, we must make every effort to communicate effectively with our residents," said State Senator Brendan Crighton. "Thank you to our federal partners and all stakeholders whose efforts helped secure this critical funding that will have an important impact on the wellness of our residents and beaches."

"From a public health and communication standpoint, we appreciate the testing and notification that this grant will fund," said Lynn Mayor Jared Nicholson. "From a recreational and environmental justice standpoint, the water quality issues at King's Beach need to be resolved so that individuals and families can enjoy the refreshing waters every warm day. I'm grateful that the EPA, DEP, EEA, LWSC, and the Town of Swampscott along with our State and Federal Delegation remain committed to working with us to find a permanent solution in order to ensure Lynn's residents have the access to the Atlantic Ocean that they so deserve."

This grant helps fund programs to ensure beachgoers know when our coastal waters are safe for swimming and recreation.

Under the Beaches Environmental Assessment and Coastal Health (BEACH) Act, EPA awards grants to eligible state, Tribal, and territorial applicants to help them and their local government partners monitor water quality at coastal and Great Lakes beaches. When bacteria levels are too high for safe swimming, these agencies or their local partners notify the public and post beach advisories or closings.

Since 2001, EPA has awarded nearly $230 million in BEACH Act grants, with about $6 million to Massachusetts and over $26 million to New England, to test beach waters for illness-causing bacteria and help with public notification and identification of the problem. This program is essential for protecting the health of beachgoers across the country.

"Protecting our beaches is truly a team effort," said MassDEP Commissioner Bonnie Heiple. "The monitoring supported by this grant arms residents with information they can use to determine when and where to swim. And understanding where water quality is challenged allows us to focus action and investment to improve public health and the health of our ecosystems."

EPA's 2024 BEACH Act grant funding will be allocated to the following New England states, Tribes, and territories contingent upon their meeting the eligibility requirements:

EPA Region 1
Connecticut Department of Public Health - $206,000
Maine Department of Environmental Protection - $254,000
Massachusetts Department of Public Health - $254,000
New Hampshire Department of Environmental Services - $194,000
Rhode Island Department of Health - $210,000

More information on BEACH Act grants.

Massachusetts Department of Public Health Interactive Beach Water Quality Dashboard


from EPA News Releases https://ift.tt/d5kP6Lh

EPA Reaches New Milestone in Cleanup of the Gowanus Canal Superfund Site Cleanup

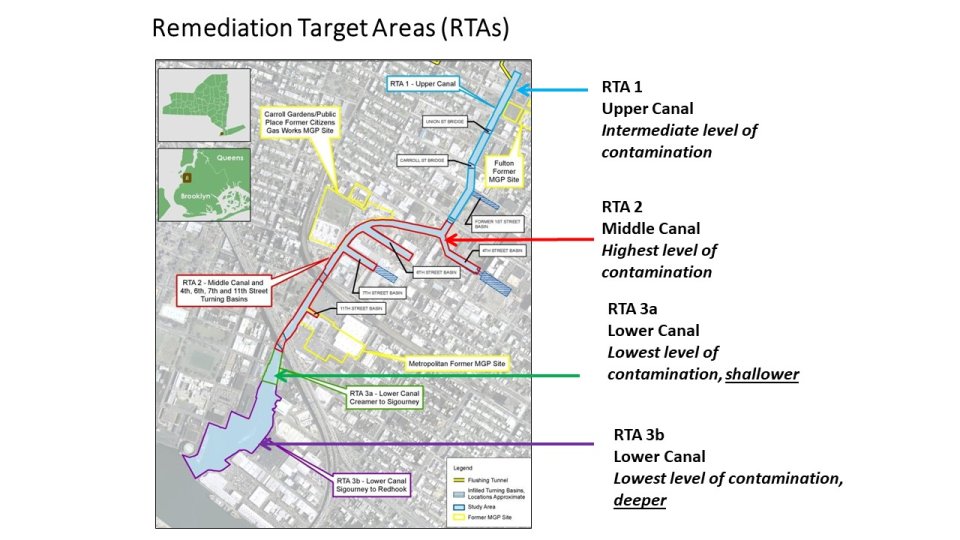
NEW YORK – Today, the U.S. Environmental Protection Agency (EPA) announced that it has amended its administrative cleanup order for the Gowanus Canal Superfund site in Brooklyn, New York on June 27, 2024, to address the middle segment of the canal – known as Remediation Target Area (RTA) 2.

“Dredging and capping of the upper segment of the Gowanus Canal started in late 2020 and will be completed in July. This is a major milestone in cleaning up the canal and improving water quality,” said EPA Regional Administrator Lisa F. Garcia. “Together with the extensive dredging, capping, and bulkhead repair work that has already been completed, this order will ensure the cleanup of the next portion of the heavily contaminated Gowanus Canal, which will be a huge benefit to the Gowanus and Red Hook communities.”  

Dredging and capping of RTA 1, the upper segment of the Canal, started in late 2020 and will be completed in July. Initial RTA 2 work, which began in late June, includes access dredging to facilitate the mobilization and use of equipment needed to conduct work in this portion of the canal, followed by debris removal and bulkhead construction. The full-scale dredging and capping required by the newly amended order will follow. That work is estimated to cost $369 million and will take several years to complete. The detailed engineering and design work for RTA 2 was performed in parallel with the RTA 1 work to accelerate its progress. RTA 3, the lower segment of the Canal, is expected to be implemented after the completion of RTA2.

Remediation Target Areas Diagram

EPA and the New York State Department of Environmental Conservation (NYSDEC) are closely coordinating the cleanup of the Gowanus Canal and the surrounding area. EPA, NYSDEC, and the New York State Department of Health have been and will continue to oversee the work, which includes plans for community health and safety monitoring. The order amendment has been issued to six parties that EPA determined have the largest shares of responsibility for the contamination at the Gowanus Canal site: Brooklyn Union Gas Co. d/b/a National Grid New York; the City of New York; Consolidated Edison Co. of New York, Inc.; Hess Corp.; Honeywell International Inc., and The Brooklyn Improvement Co.

More than a dozen contaminants, including polycyclic aromatic hydrocarbons (PAHs), polychlorinated biphenyls (PCBs), and heavy metals, including mercury, lead, and copper, are present at high levels in the Gowanus Canal sediments. The 2013 cleanup plan for the Gowanus Canal Superfund site includes dredging to remove contaminated sediment from the bottom of the Canal that has accumulated because of industrial and combined sewer overflow (CSO) discharges. Following dredging, construction of a multilayer cap in dredged areas will isolate and prevent migration of any remaining chemicals in the deep native sediment. Certain areas of the native sediment, below the original canal bottom, that contain mobile liquid tar and are too deep to excavate, will be mixed with cement and solidified to prevent the spread of the tar into the water of the Canal. Two CSO retention tanks are being constructed by the City of New York will prevent the hazardous substances found in CSO solids from re-contaminating the Canal. The current cost of the overall cleanup plan is estimated to be over $2 billion, including both the in-Canal work and CSO controls.

Visit the Gowanus Canal Superfund site profile page for additional background and site documents.

Follow EPA Region 2 on X and visit our Facebook page. For more information about EPA Region 2, visit our website.

24-051


from EPA News Releases https://ift.tt/7KbL9Ha